


Cracking the Financial Code: A Guide to Decoding a Company's Balance Sheet, Income Statement, and Cash Flow Statement
How to Analyze Financial Statements, Company News, & Weekly Activity

How to Analyze Financial Statements
Every company has three primary financial statements. Of these three, each answers a unique question:
Balance Sheet: What’s is the company’s net worth?
Income Statement: Is the business profitable?
Cash Flow Statement: Is the business generating cash?
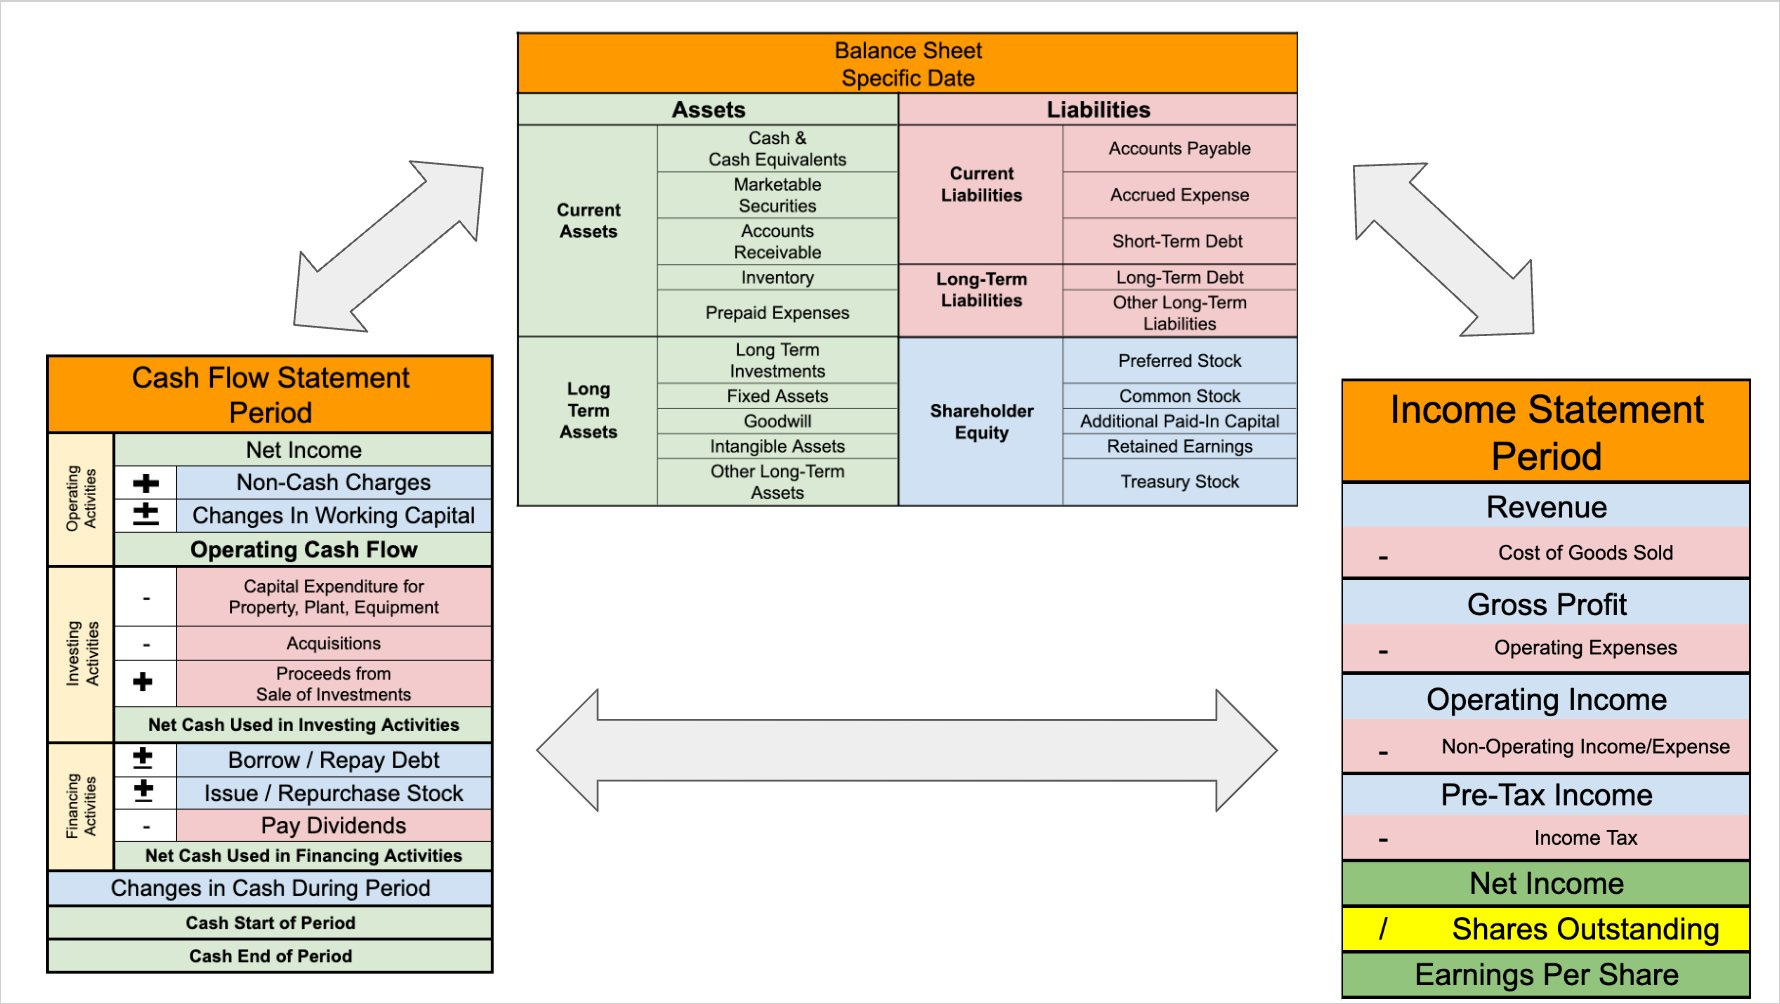
All of these financial statements essentially connect in a way. Each one views a company’s financials from a different angle, and when combined, they provide a more complete view of a company’s true financial position. So, this week I want to discuss how to properly analyze each of them. Many investors stay away from individual stocks because they are unable to fully interpret these financial statements, and I believe this will help many current and future stock pickers make more informed decisions when/before investing in a certain business.
Analyzing a Balance Sheet
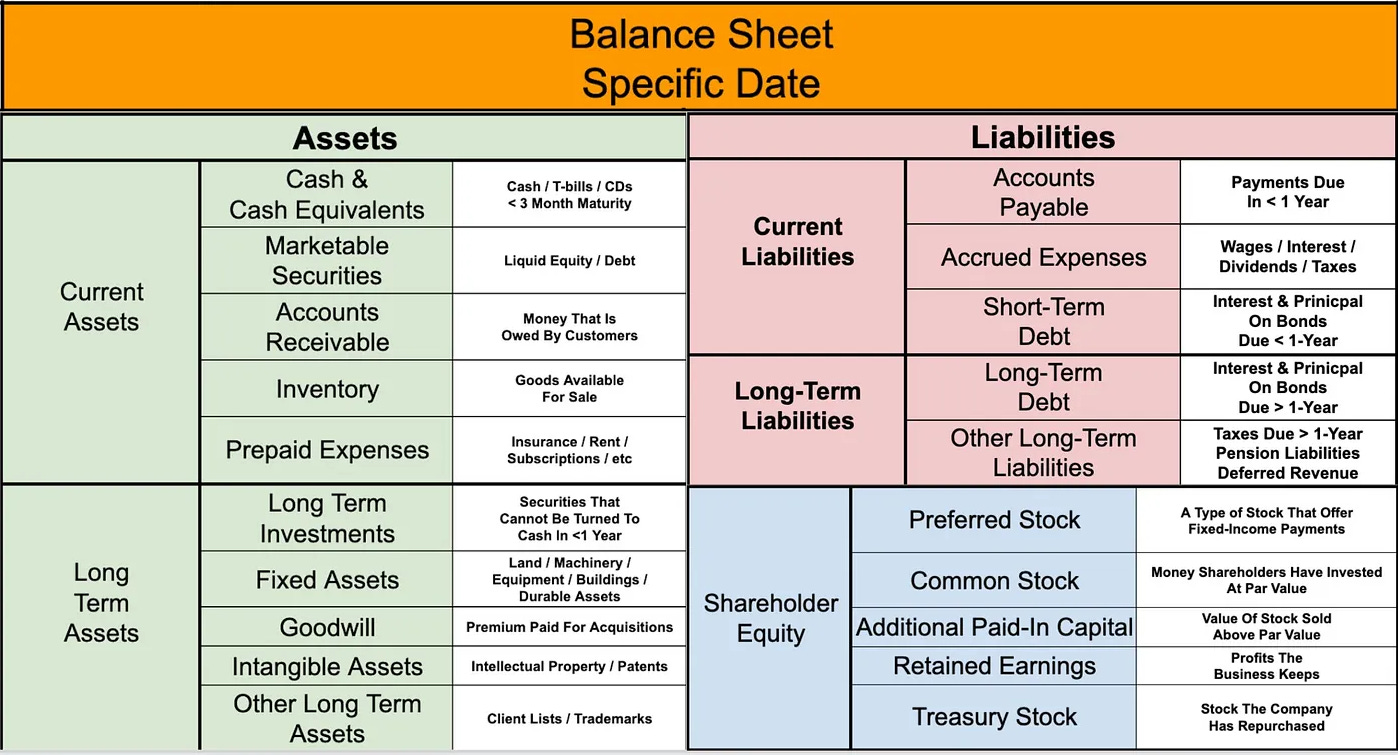
The balance sheet is one of the three major financial statements. It shows a company’s: Assets (What it owns), Liabilities (What it owes/debt), and Shareholders Equity (Its net worth). Management teams have some leeway in categorizing their balance sheet. This ultimately means that not all balance sheets will look the same. The illustration below shows some of the most commonly used terms and what they mean.
The golden question that needs to be answered when analyzing a balance sheet: Is this balance sheet strong, average, or weak? Why? Strong balance sheets give companies options, weak balance sheets eliminate options. The strength of a company’s balance sheet is especially important during tough economic times (kind of like now). Strong balance sheets gives a business the option to play offense during economic downturns. For example, being able to acquire rivals, hire a talented workforce, or even gain market share. Now, a weak balance sheet forces a business to play defense during tough economic times, they will attempt to cut costs, start laying off workforce, and even delay planned projects.
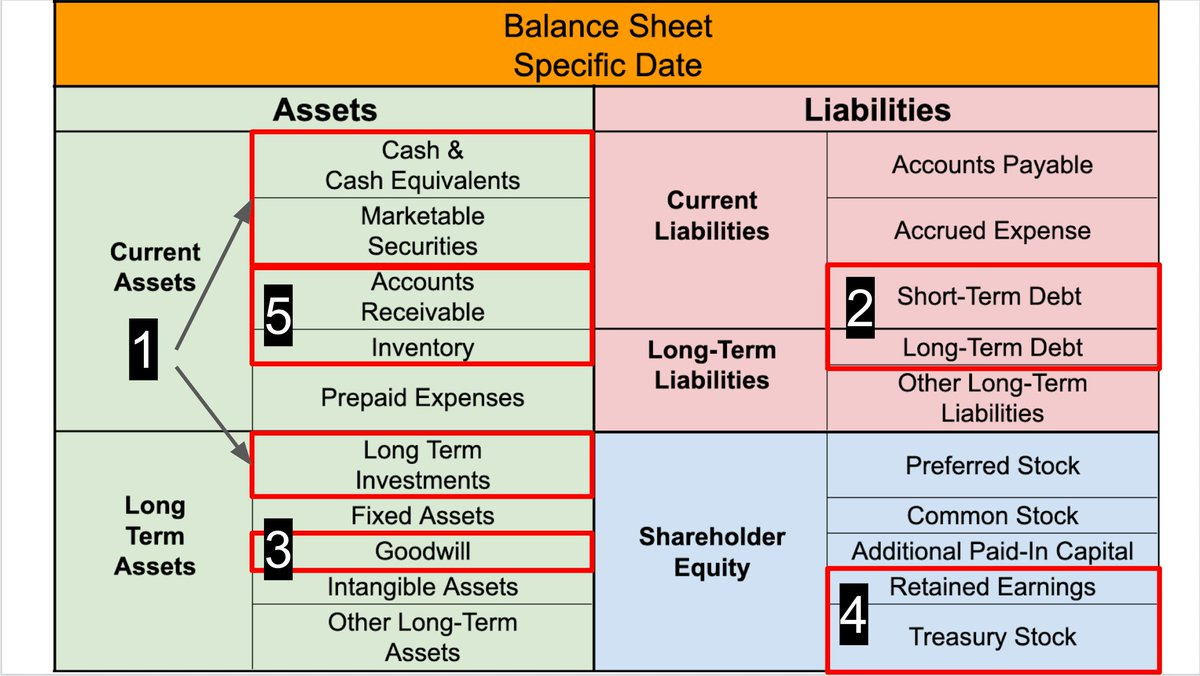
What do you look for in determining if a business has a strong or weak balance sheet? Here are a couple terms you need to focus on: Cash & Equivalents (How much?), Debt (How much? What kind?), Goodwill (How much?), Retained Earnings (Positive?), and Receivables & Inventory (How much?). Below shows the highlighted terms to look for when analyzing a business’s balance sheet.
Now, for the Cash & Equivalents, you will ideally want to see this in the millions/billions (depends on company size). For example, comparing a mega-cap company to a micro/small-cap company’s Cash & Equivalents position, is going to be much different. When we look Debt, in a perfect world, you would like to see $0. However, depending on what kind of an investor you are and the type of investments you are making, this will vary. Profitable mega-cap businesses will more than likely have minimal/no debt, but your smaller high-growth businesses that are unprofitable, working to profitability, will more than likely carry debt.
Taking a look at Goodwill, this basically represents the excess value of an acquired business over the fair market value of its identifiable assets and liabilities. So, in other words, it's the amount paid by the acquiring company for an acquired business that is not directly attributed to any tangible or identifiable assets. If the value of the Goodwill asset is found to be less than its carrying amount, the company must recognize an impairment loss, which reduces the value of the Goodwill asset on the balance sheet. The amount of Goodwill on a business's balance sheet can vary widely depending on the industry, the size of the business, and the nature of the acquisitions made by the company. There’s not really a "normal" statistic for Goodwill on a business's balance sheet. However, it's worth noting that in certain industries, such as technology or healthcare, the value of intangible assets, including Goodwill, may make up a significant portion of a company's overall assets. In contrast, for other industries such as manufacturing or retail, goodwill may be less significant. BUT, you ultimately want None in this category.
Next, we have Retained Earnings. On a company's balance sheet, Retained Earnings are listed as a component of shareholders' equity. This is a portion of a company's net income that is kept by the company instead of distributing toward growth initiatives; for example, it can be used for a variety of purposes, such as reinvesting in the company for growth, paying off debt, or distributing dividends to shareholders in the future. Retained Earnings can increase or decrease over time depending on the company's net income and policies mentioned above (dividends, paying off debt, company growth). So, depending on how mature the business is, it may have a large amount of retained earnings on its balance sheet. This indicates that it has reinvested profits into the business. Alternatively, a company with a history of losses or aggressive dividend policies may have low or negative retained earnings. Investors should see this in the Positive.
Lastly, we have Receivables and Inventory. These are two important items that appear on a company's balance sheet that investors should be aware of. Receivables, also known as accounts receivable, are amounts owed to the company by its customers or clients for goods or services that have been sold but not yet paid for. They represent the company's right to receive payment in the future and are typically recorded as current assets on the balance sheet. The balance of accounts receivable represents the total amount of money owed to the company by its customers.
Inventory, on the other hand, refers to the goods or materials that a company holds for sale or production. It includes raw materials, work-in-progress goods, and finished products (obviously it depends on the industry/business). Inventory is also recorded as a current asset on the balance sheet… the balance of inventory represents the total cost of the goods or materials held by the company.
Both Receivables and Inventory are important indicators of a company's financial health and performance. Receivables represent the company's ability to generate revenue, while inventory represents its ability to manage its supply chain and meet customer demand (this term on the balance sheet will require extra attention depending on the industry/business). The management of these assets is critical to the success of any business, as they can impact a company's liquidity, profitability, and overall financial stability. Ultimately, the ideal Receivables and Inventory levels for a business will depend on a range of factors, including the business model, industry trends, and economic conditions. Investors don’t want to see this at astronomical highs, they want them low, sustainable, and consistent. But again, this depends on a ton of factors.
How to Analyze an Income Statement
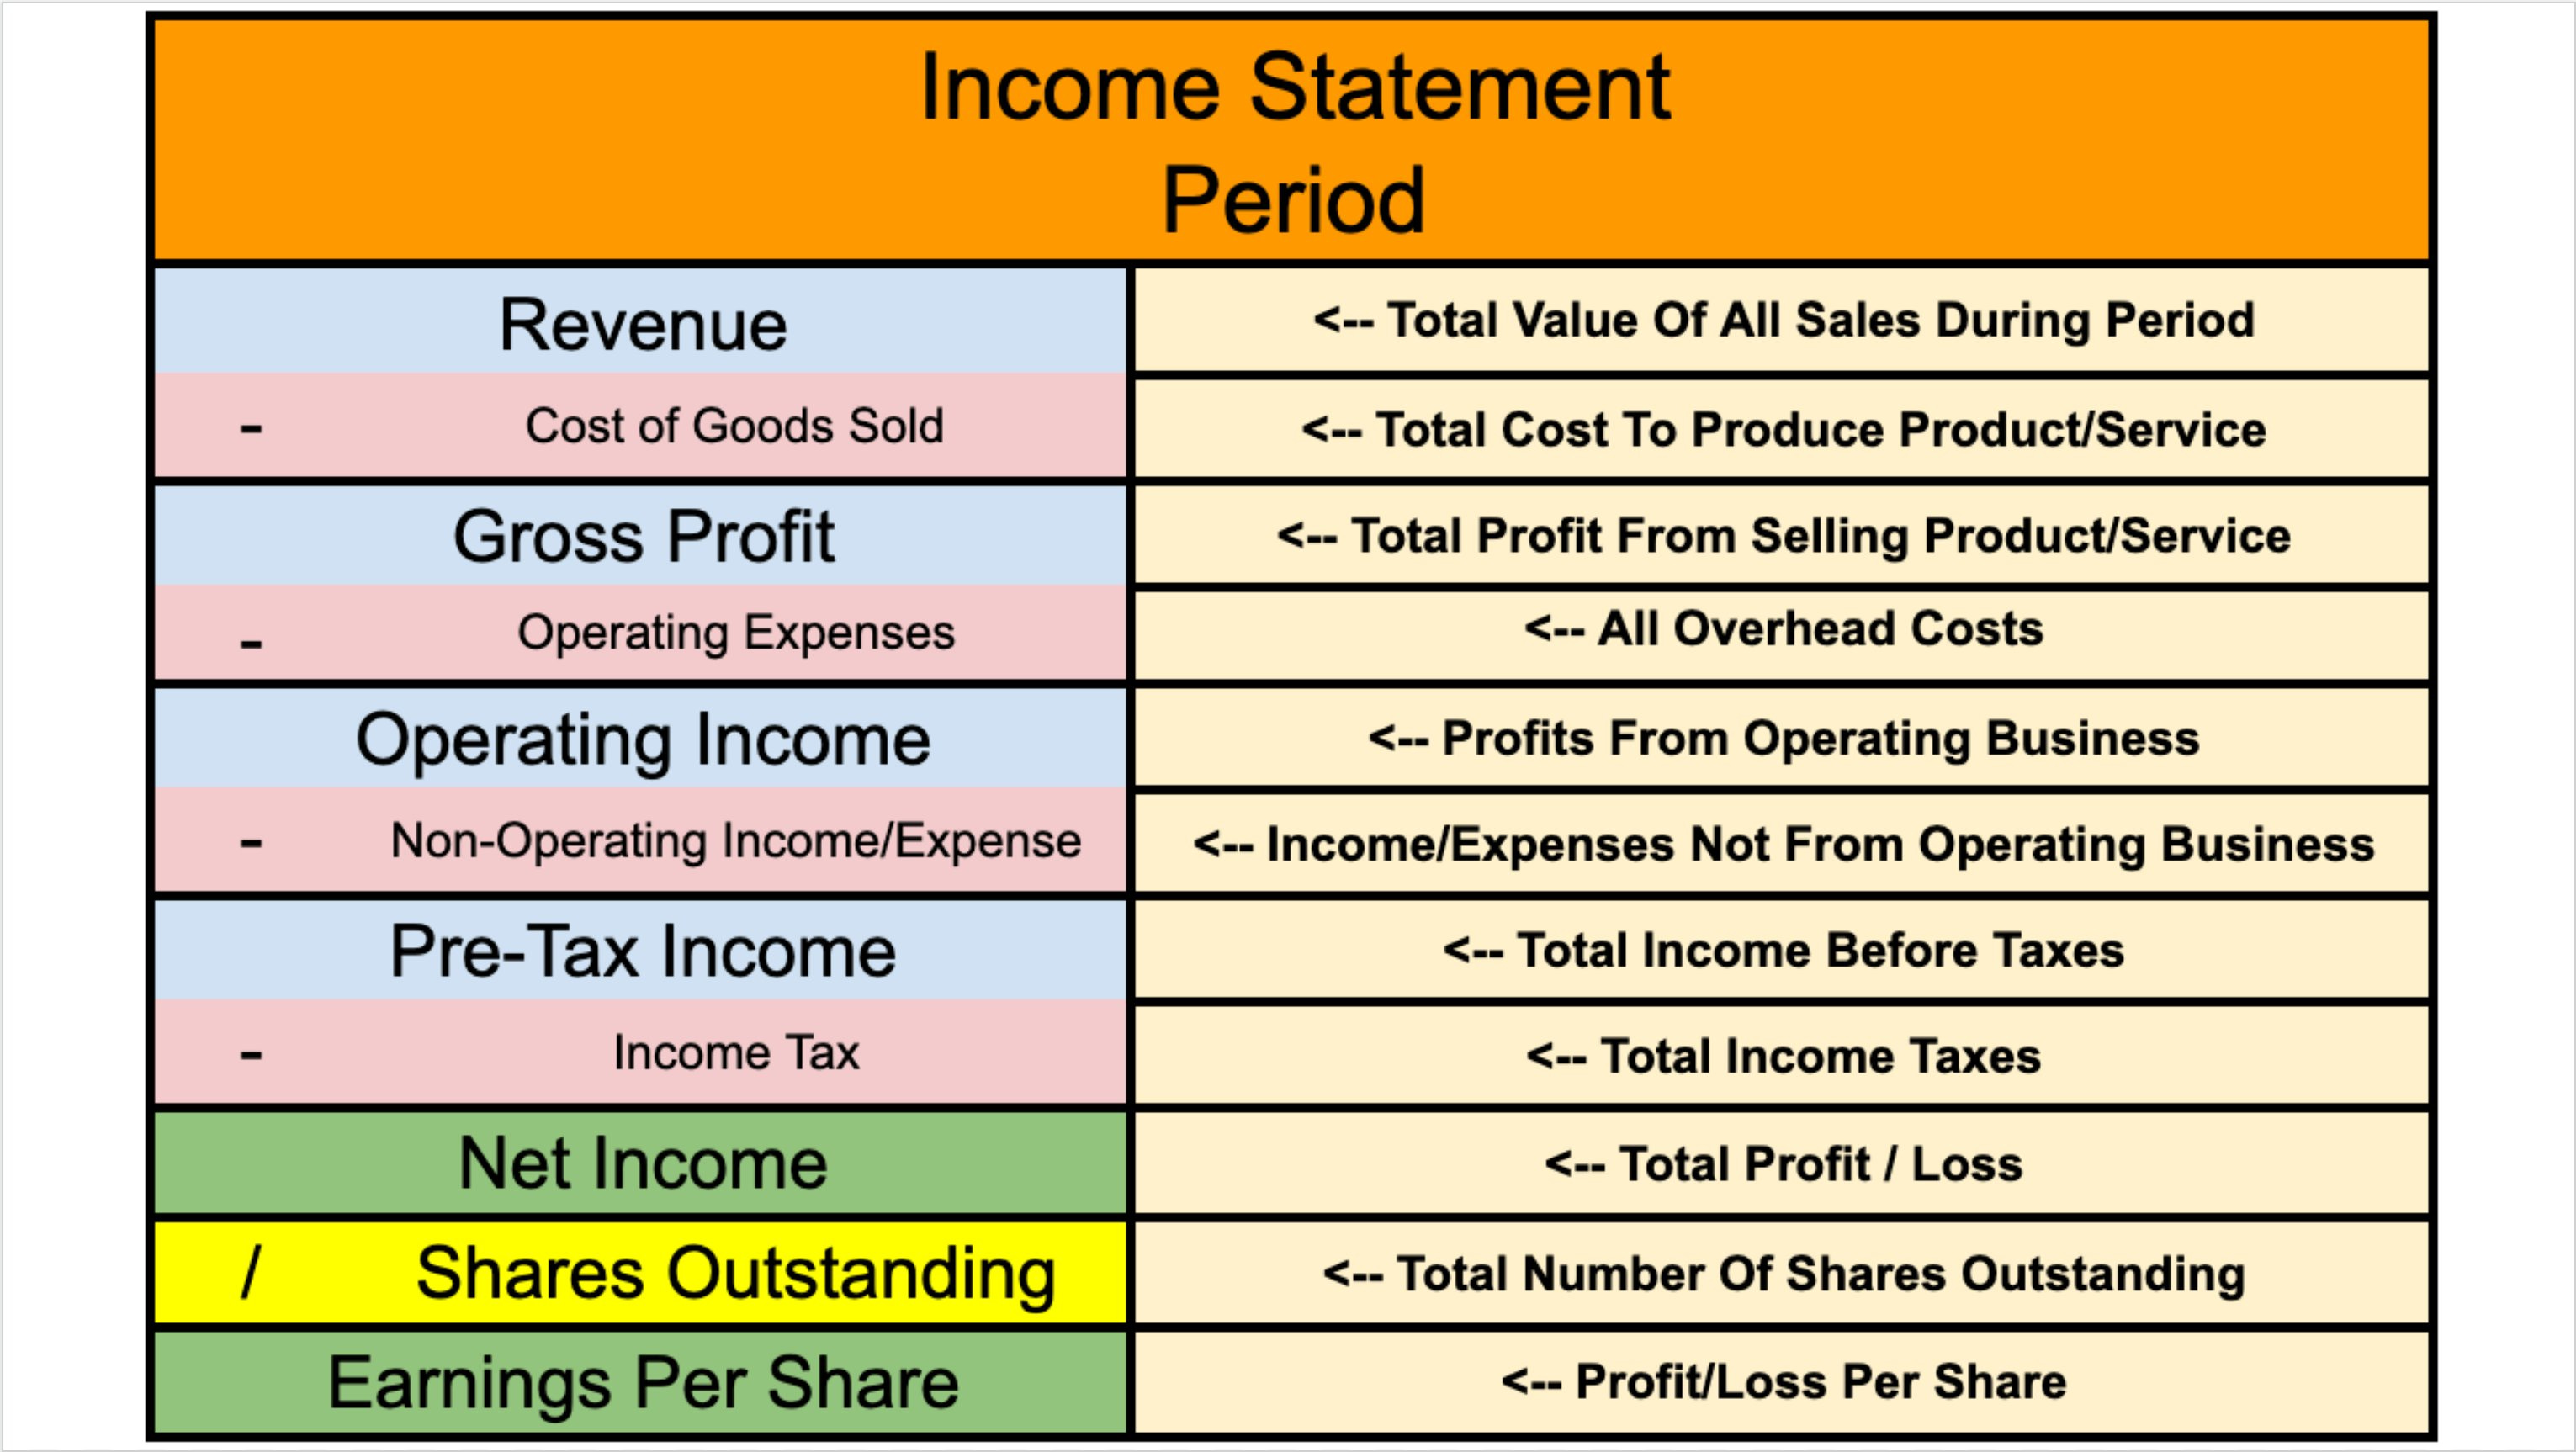
The income sheet is one of the three major financial statements. It shows a company’s Revenue (Sales), Expenditures (Costs/Expenses), and Net Income (Earnings, Profits) over a period of time. Management teams have some leeway in categorizing their income statements, this means that not all income statements will look the same. Here is what your typical layout would look like and the meaning of the most commonly used terms:
When we look at a company’s Income Statement, we are looking for the answer of two BIG questions: is the business profitable? and is the company growing or shrinking?
In order to find the answer to these questions, this is what I like to look for… 1. The Term/Period (Quarter? Year?), 2. Revenue (What direction is this headed?), 3. Gross Profit (What direction is this headed?), 4. Earnings Per Share (Is this positive?), 5. Share Count (What direction is this headed?), and 6. Operating Costs (What direction is this headed?).
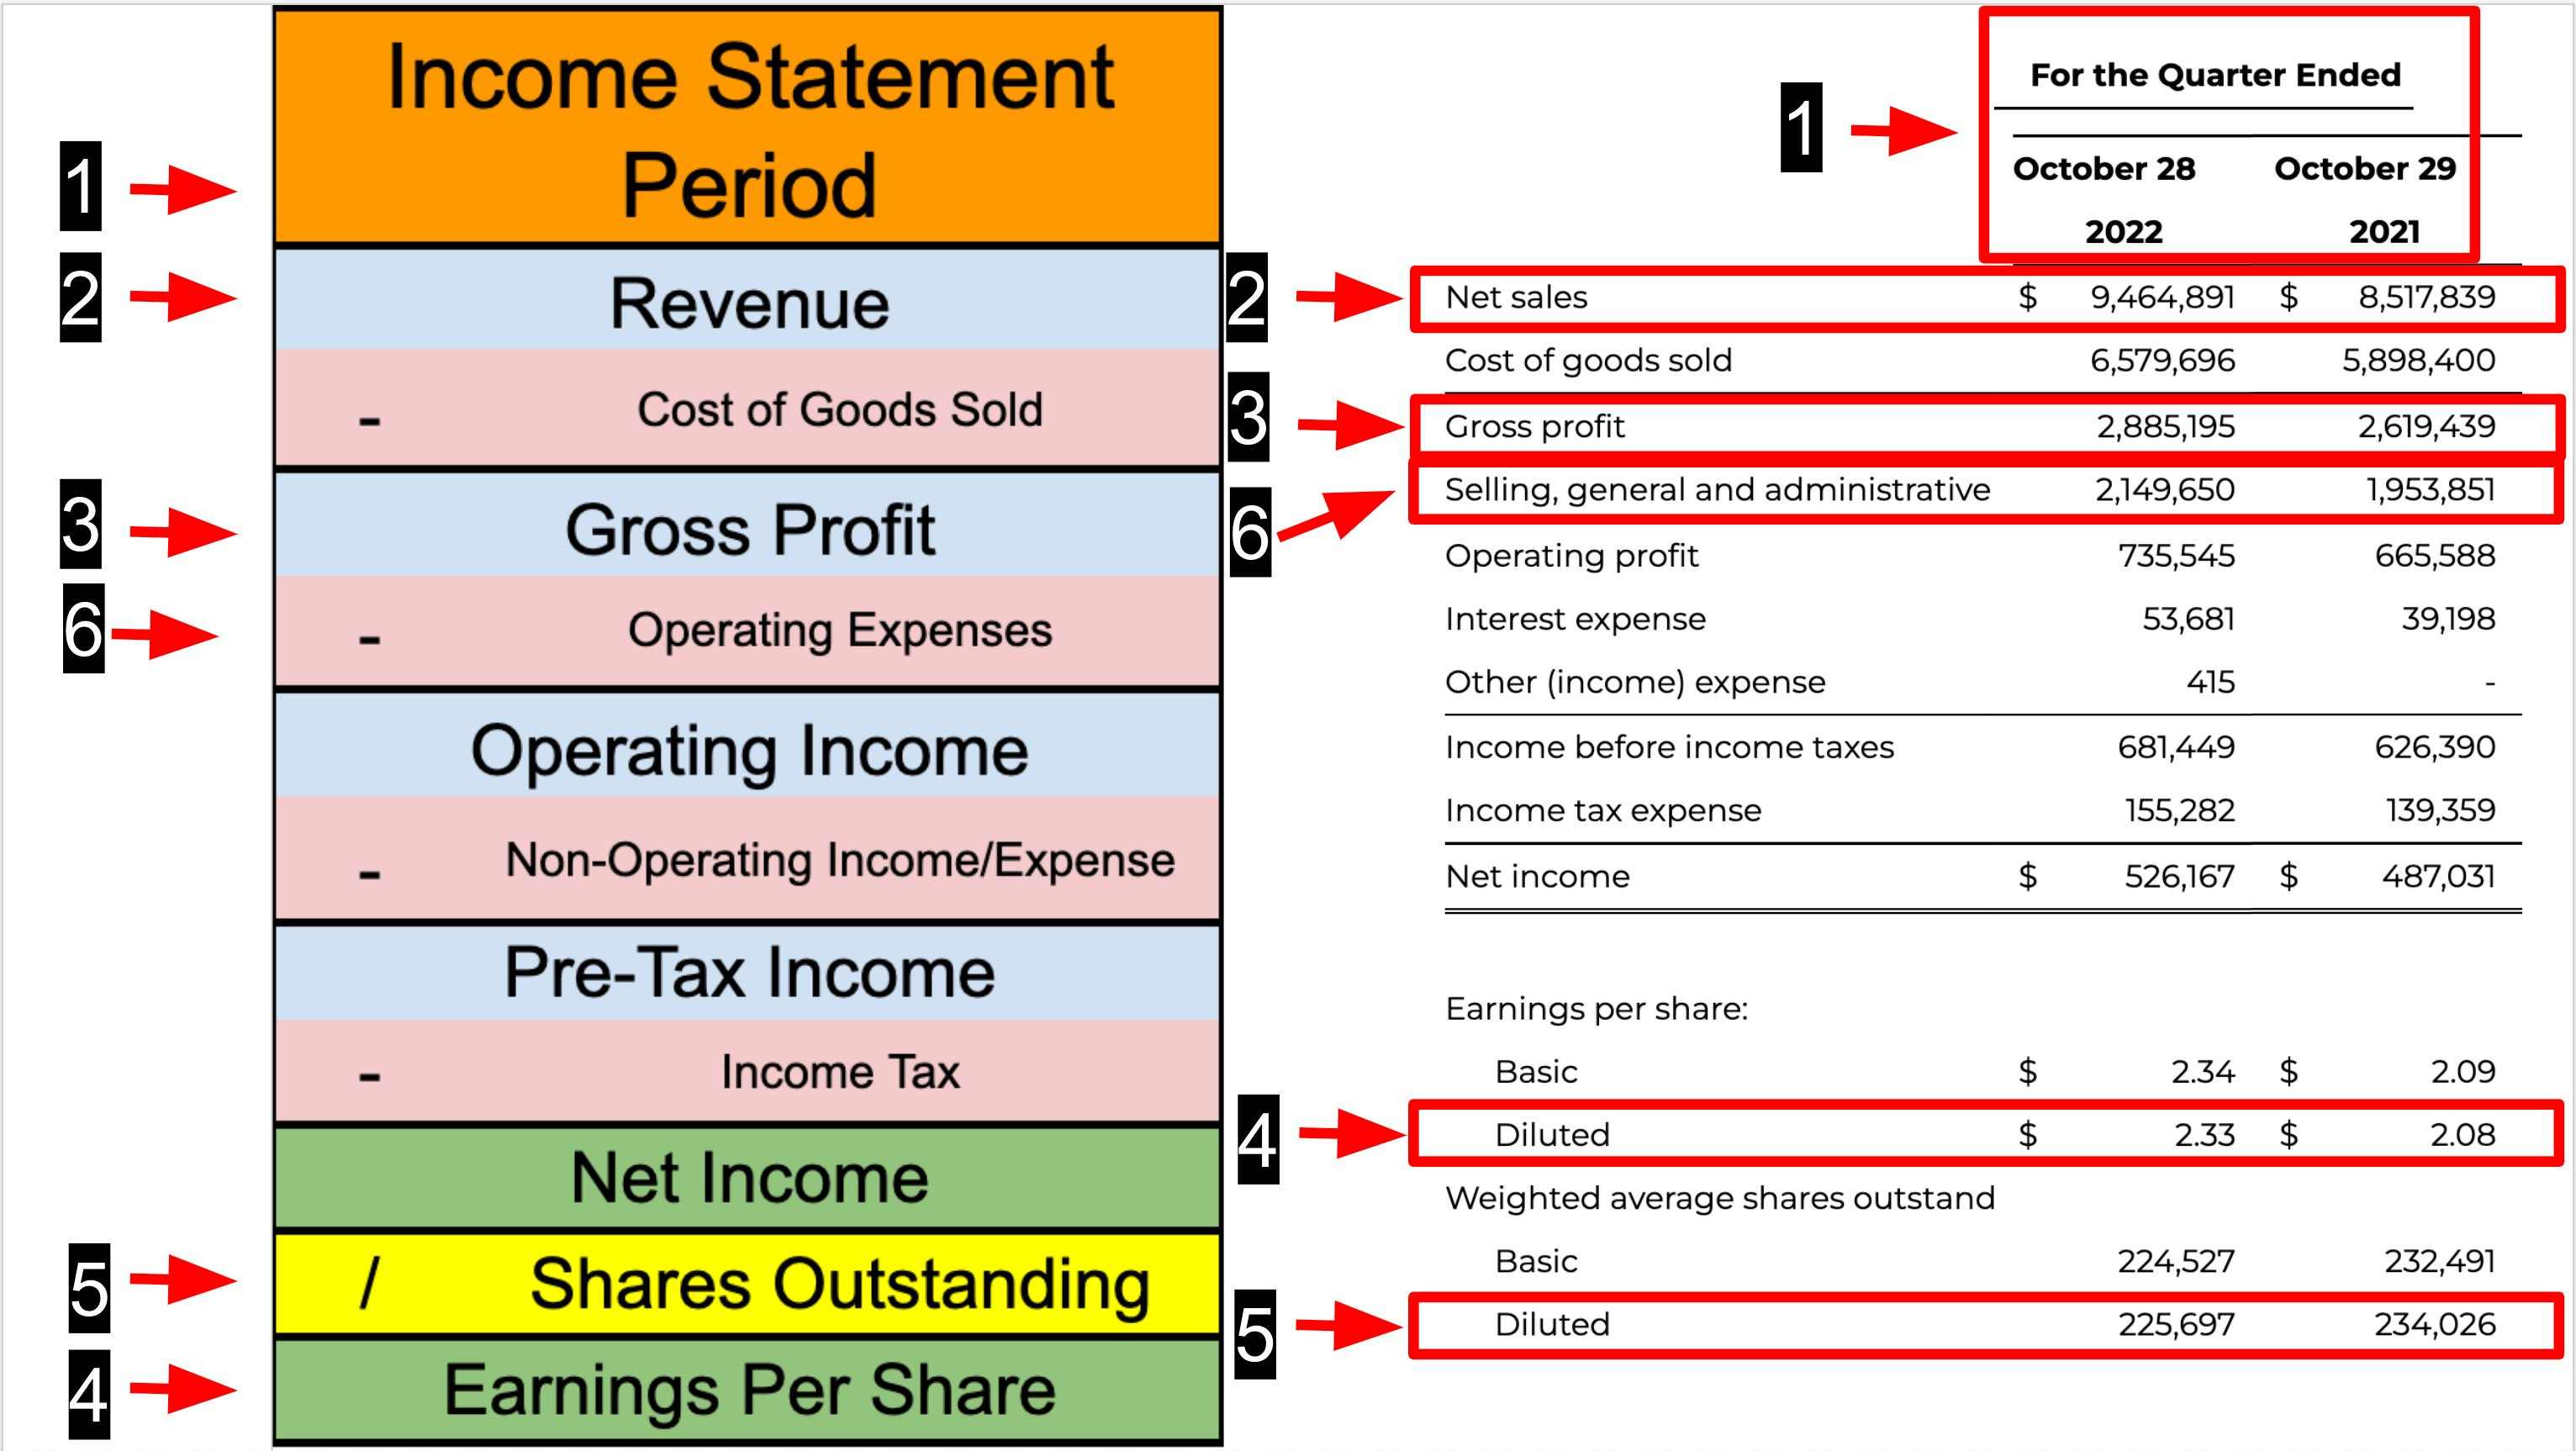
This illustration above serves a map to the questions I mentioned above. By giving this a brief read through, you should have a sound understanding of how to answer them. When I look at The Term, I always pull up multiple annual periods… especially if it’s a new company I want to add to my portfolio. Quarterly growth is great to analyze too, but at the end of the day, YoY growth has more importance. As seen above you have October 2021 and October 2022 as comparable.
When we look at the company’s Revenue, which is known as sales revenue or net sales, it represents the total amount of money that a company earns from the sale of its products or services during a specific period of time. Like shown above, business “X” went from $8.5M rev to $9.4M rev YoY, which is around a 10% increase. Revenue is an important indicator of a company's financial performance, as it reflects the company's ability to generate income from its core business operations. Revenue growth is generally viewed as a positive sign of a company's health and potential for future success. However, it's important to emphasize that Revenue does not represent a company's net income or profit, as it does not take into account any expenses associated with running the business. To determine a company's overall profitability, it is necessary to subtract all expenses from its revenue to arrive at its net income or net profit. Depending on the type of investor and businesses you are investing in, you want to see this growing relatively quickly. Multiple periods of declines is a sign of a business in distress, rising Revenue shows a company growing (likely succeeding).
Gross Profit is an important indicator of a company's financial health and profitability, and it is often used by investors to evaluate a company's performance over time. A high Gross Profit indicates that the company is able to generate a significant amount of Revenue from its products or services while keeping its costs relatively low. As an investor, you want this growing faster than your Revenue.
Next, Earnings Per Share (EPS) is a metric that represents the portion of a company's net income that is allocated to each outstanding share of its common stock. It is an indicator of a company's profitability and financial performance. EPS is calculated by dividing a company's net income by the total number of outstanding shares of its common stock. The resulting figure represents the amount of earnings that are available to each share of the company's stock. A company's EPS can vary significantly depending on a range of factors, including its revenue, expenses, taxes, and outstanding shares. Usually, a higher EPS is viewed as a positive sign of a company's financial health and profitability, as it indicates that the company is generating a greater amount of earnings per share. Investors want this growing faster than Gross Profit.
Many investors don’t understand the importance of our next term, this is our Share Count/Shares Outstanding of a business. This is the total number of shares of a company's stock that are issued and held by investors, including both institutional investors and individual shareholders. Shares Count is extremely important, especially for growth investors, because this affects a company's market capitalization… which is the total value of all outstanding shares of its stock. The higher the number of shares outstanding, the lower the value of each individual share. Conversely, if a company has a low number of shares outstanding, the value of each individual share will be higher. Investors want to avoid being diluted; they want this number declining through buybacks.
Lastly, I like to look at Operating Costs/Expenses (Opex). These are the expenses that a company incurs as part of its normal business operations. Opex can include a wide range of costs, such as salaries and wages, rent, utilities, advertising, insurance, and supplies, among others. Opex is deducted from a company's revenue to arrive at its operating income, which is a key metric used to evaluate a company's profitability. So, the lower a company's opex is in relation to its revenue, the higher its operating income will be. The types and amount of opex varies widely depending on the business and the industry it operates. For example, a manufacturing company may have significant operating expenses related to the cost of raw materials, production equipment, and labor, while a service-based company may have more modest operating expenses related to rent, utilities, and office supplies. But ultimately, investors want to see this growing slower than Revenue.
How to Analyze a Cash Flow Statement
The cash flow statement shows how cash moves in and out of a company over a period of time. Its purpose is to track cash movement through a business. Bear with me on this, but the cash flow statement uses “Cash Accounting”. This method only records transactions when money goes in or out of an account. This differs from “Accrual Accounting”, which is the accounting method used on the income statement and balance sheet we just went over. Here’s a visual below:

The cash flow statement will answer these four questions:
1. Is the business generating/consuming cash?
2. How much reinvestment is there?
3. Is the business free cash flow positive?
4. How is the company financing itself?
So, here’s what I focus on first when looking at a cash flow statement: 1. The Term/Period (Quarter? Annual?), 2. Operating Cash Flow (Positive?), 3. Capital Expenditures (How much?) and Free-Cash-Flow (Positive?), 4. Stock-Based Compensation (How much?), 5. Stock buybacks?, 6. Changes in debt?
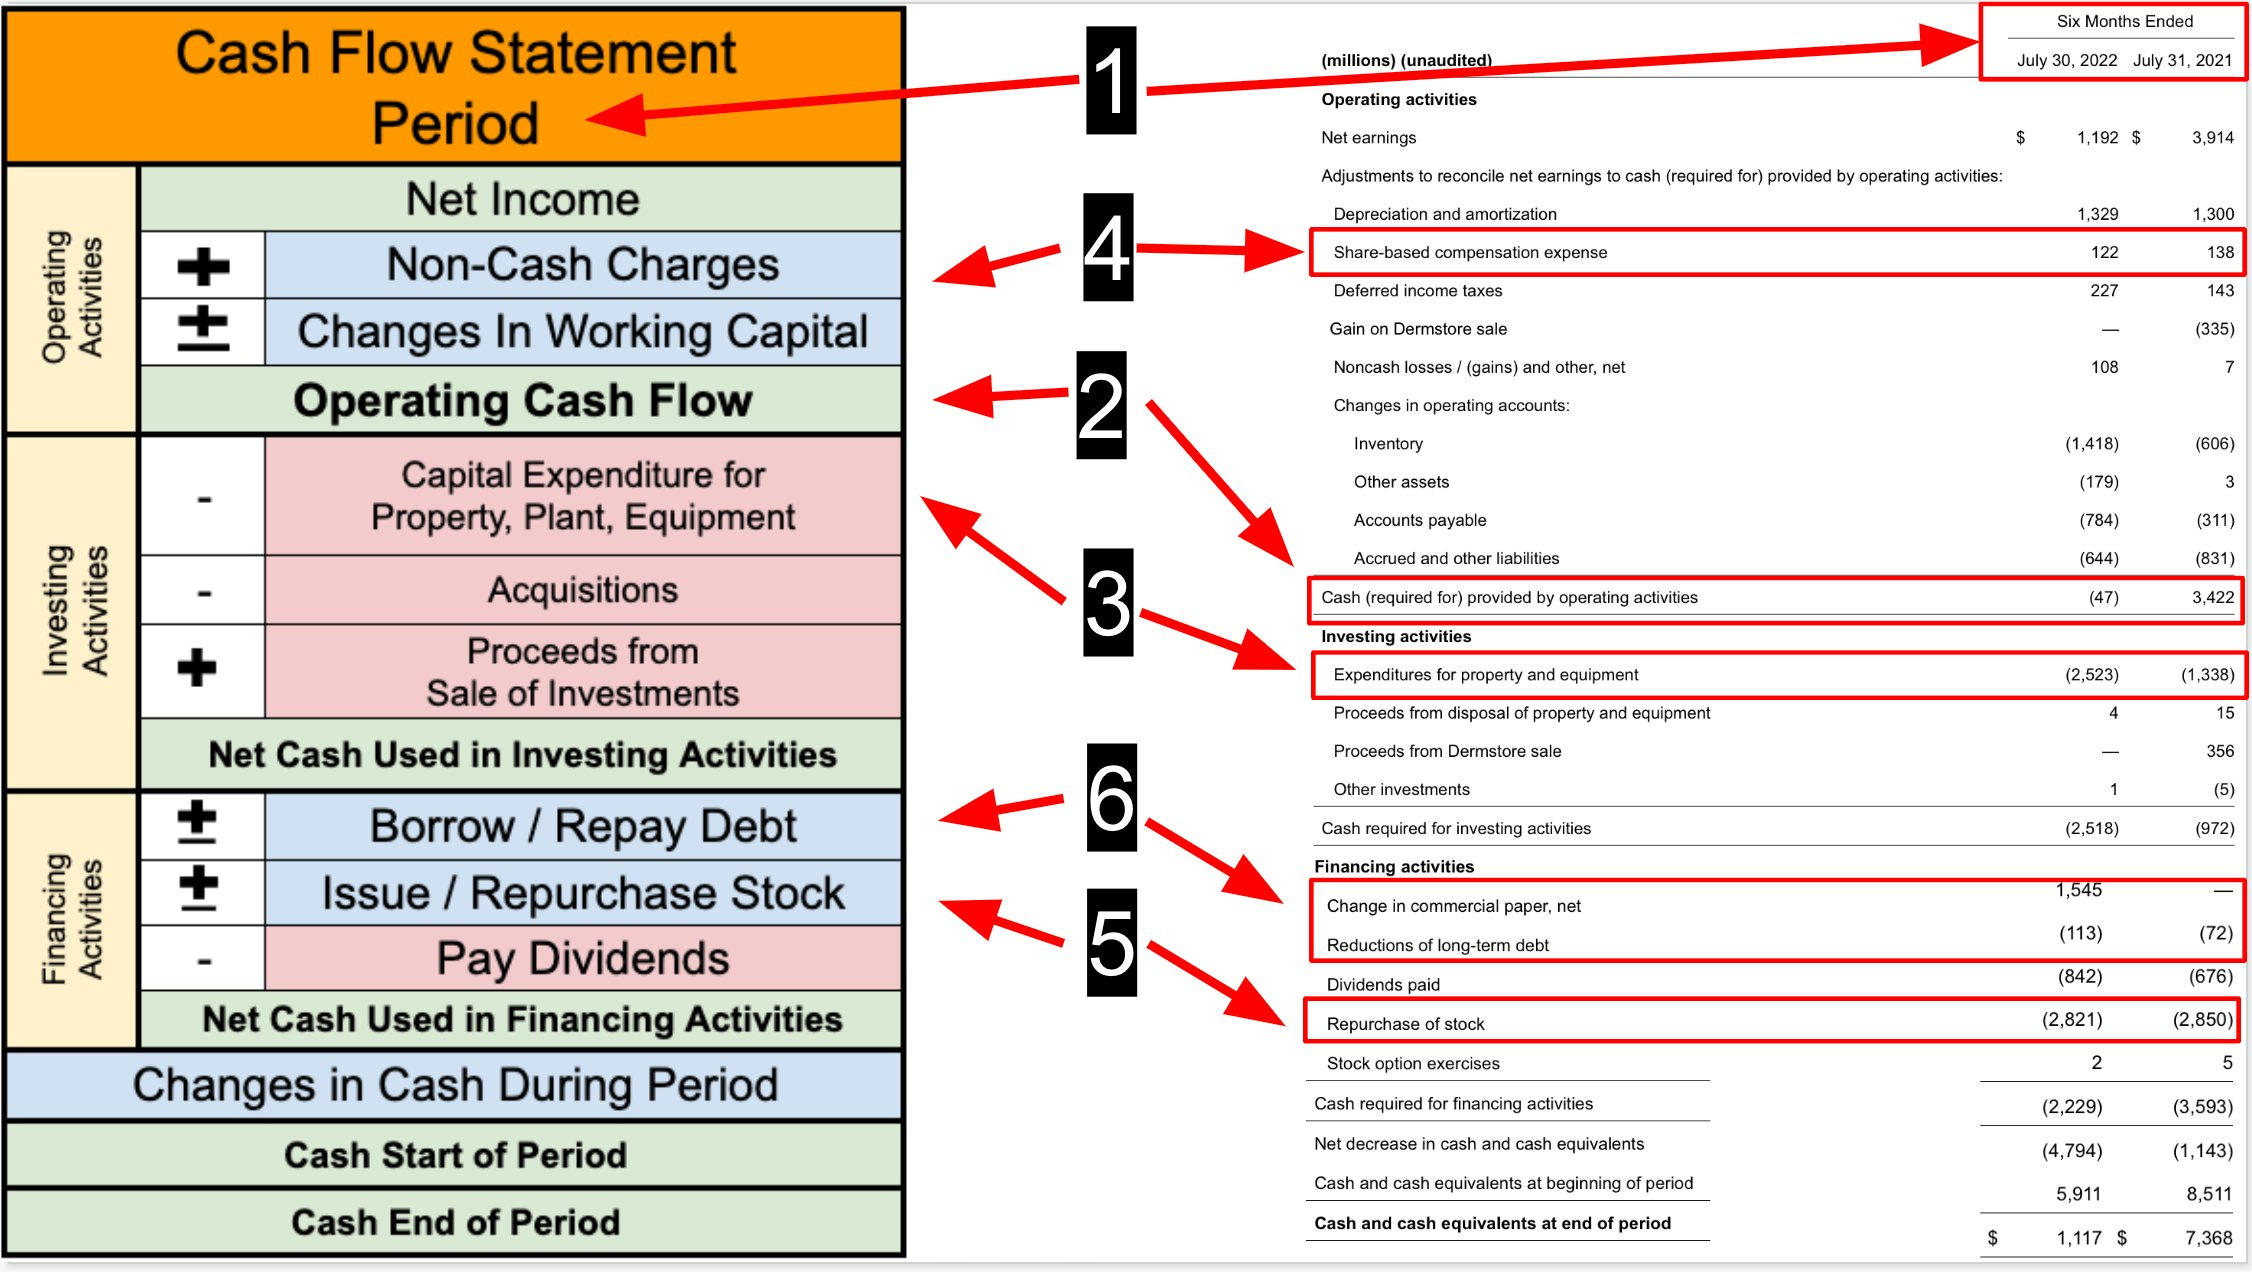
This is very similar to our previous income statement, as in if you give this a brief read through you should have a solid grasp of the terms listed and answers to most of the questions mentioned above. The Term/Period, you should always analyze multiple annual periods, quarterly periods are generally good too, but the importance is YoY stats.
Operating Cash Flow (OCF) measures the amount of cash that a company generates from its operating activities, such as sales of products or services, minus its operating expenses over a specific period of time. OCF is calculated by subtracting a company's operating expenses, including cost of goods sold, salaries and wages, rent, and other expenses, from its revenues, and then adding back any non-cash expenses, such as depreciation or amortization. So, a positive OCF indicates that a company is generating cash from its core business operations, while a negative OCF suggests that the company may be struggling to generate enough cash to cover its operating expenses. Investors want to see this in the positive and growing.
When analyzing Capital Expenditures (CapEx), these refer to the funds a company uses to acquire or upgrade physical assets, such as property, equipment, or machinery. CapEx is typically considered a long-term investment, as these assets are expected to generate benefits for the company over several years. CapEx is often used to expand a company's operations, improve its infrastructure, or develop new products or services, while stock buybacks are typically used to return capital to shareholders or support the company's stock price.
Free-Cash-Flow (FCF) measures the amount of cash a company has left over after it has paid for all of its expenses and investments in its physical assets. To calculate FCF, you subtract a company's capital expenditures from its operating cash flow. Operating cash flow refers to the cash a company generates from its core operations, such as sales, minus the cash it pays for its operating expenses. The resulting FCF can be used for a variety of purposes, such as paying dividends to shareholders, repaying debt, investing in new opportunities, or buying back shares of its own stock. A positive FCF indicates that a company has generated more cash than it has spent on capital expenditures, which can be a good sign for investors. It suggests that the company has enough cash to fund its operations and investments while also having cash left over for other purposes. On the other hand, a negative FCF suggests that a company is spending more on capital expenditures than it is generating in cash from its operations, which can indicate financial strain and potentially limit a company's ability to invest in growth opportunities or return capital to shareholders. Investors want to see nothing greater than 10% of earnings and positive FCF.
Stock-Based Compensation (SBC) is a type of employee compensation that is paid in the form of company stock or other equity-based instruments, rather than in cash. SBC can take various forms, such as stock options, restricted stock units (RSUs), or performance-based stock awards. Stock options give employees the right to buy company stock at a set price (the exercise price) for a set period of time, while RSUs and performance-based stock awards grant employees actual shares of stock that vest over time or upon the achievement of specific performance goals. The value of SBC is typically based on the market price of the company's stock or the fair value of the equity-based instrument granted. This means that the value of SBC can fluctuate with changes in the stock price and can have a significant impact on a company's financial statements. Also, it can have an impact on a company's cash flow, as it may need to issue new shares of stock to fulfill the equity-based awards granted to employees. SBC be used as a way to attract and retain talented employees, align their interests with those of the company, and encourage them to work towards the company's long-term success. With that said, it can also dilute the ownership percentage of existing shareholders and increase the number of outstanding shares, which can have an impact on the company's earnings per share and overall market valuation. Investors want to see nothing greater than 5% of earnings in SBC, ideally.
Stock buybacks, also known as share repurchases, occur when a company uses its cash reserves to purchase its own outstanding shares of stock from the market. This reduces the number of shares available in the market and effectively increases the ownership percentage of the remaining shareholders. These can be used to increase shareholder value, signal to the market that the company believes its shares are undervalued and improve earnings per share by reducing the number of outstanding shares. Investors want to see businesses buying back their own stock.
Lastly, when looking at debt, investors don’t want to see any changes in this column (none ideally). If a business has debt and is working to pay it down significantly, investors want to see a decrease but no increases.
Like mentioned previously, these financial statements are interrelated. Each views a company’s financials from a different angle. When combined, they provide a more complete view of a company’s true financial position.
Hopefully, what we went over this week gives more color on how to properly analyze a company’s financial statements. I wanted to take the time to make a publication like this, because it’s one of the main reasons investors stay away from stock picking. They are unable to properly analyze business and simply don’t understand all the jargon. It will take practice to get better at it, but once you get the hang of it, this part of investing becomes FUN.
Company News & Weekly Activity (April 17th-21st)
This past week wasn’t that special for me on the buy-side, but I did make another move on the sell-side. Before we get to the activity of my portfolio, there are two positions that I’d like to give an update on.
Procter & Gamble (PG)
PG announced their Q1 2023 earnings this past week and beat on all metrics (Rev, EBITDA, EPS). The market loved this news and PG was able to hit 5% on one trading day, pretty big move for one of the largest businesses on the market. This led me to a trim in my PG position… which now represents just over 8% of my portfolio. I said I would hold this winner, but the jump that significant led me to trim a small portion and allocate into greater opportunities (more on that below).
Magnite (MGNI)
Magnite didn’t report Q1 2023 earnings last week, but they did announce a HUGE service to their business that expands into the Demand-Side Platforms (DSP) like The Trade Desk. MGNI launched ClearLine, a platform designed to give media buyers access to “premium video inventory” without the need for a demand-side platform and without disintermediating agencies or other tech players. Much of the AdTech space was shook by this news because many have been focusing their attention on other competitors like PubMatic, The Trade Desk, Google, and Amazon. I believe this was a phenomenal move by CEO Michael Barrett… he’s countering The Trade Desk’s OpenPath initiative that cuts out Supply-Side Platforms (SSPs) like Magnite and PubMatic. I have told my followers in the past you should have a basket-approach to AdTech (you still should) and how my MGNI position is still a hold, but I may consolidate MGNI a bit more depending on how the coming weeks/earnings go. I highly recommend referencing my “Cord Cutters” publication on AdTech for more detailed information.
Following the news of PG’s impressive quarter, I trimmed my position. This makes PG still a top 3 position in my portfolio and makes my cash position around 4%. Moreover, I set an order to buy 25 shares of Lemonade (LMND) at its 52-week low and it executed this week. This now makes Lemonade a significant position in my portfolio, its trading at absurdly low prices. So, I’m going to take advantage of this.
Personal Brokerage
25 shares of Lemonade
Roth Ira
Nada.
“Investing is the intersection of economics and psychology.” - Seth Klarman
Sources: Investopedia.com, Pginvestor.com, beet.tv.