

Earnings Reports (October 16th-20th)
Taking a Look at Earnings Reports for Johnson & Johnson, Lockheed Martin, & Procter & Gamble

Earnings season is upon us again, and as always, I'm excited to dive into the financial performances of businesses within my coverage. True to my past commitments, I will be providing comprehensive breakdowns of these earnings at no cost to you. This week, we'll be shining a spotlight on three prominent companies that I hold in high regard: Johnson & Johnson (JNJ), Lockheed Martin (LMT), and Procter & Gamble (PG). Both Procter & Gamble and Lockheed Martin secure spots in my top 10, with Johnson & Johnson not far behind. So, let's take a closer look at what these companies have to offer this earnings season.
1. Johnson & Johnson (JNJ)
Johnson & Johnson (JNJ) released its financial outcomes for the third quarter of 2023 this week, highlighting significant growth and promising forward guidance. It should be noted that the financial data and guidance that will be provided pertains solely to JNJ’s continuing operations, attributed to the final separation of its Consumer Health (Kenvue) business from its primary operations.
Key Financial Highlights:
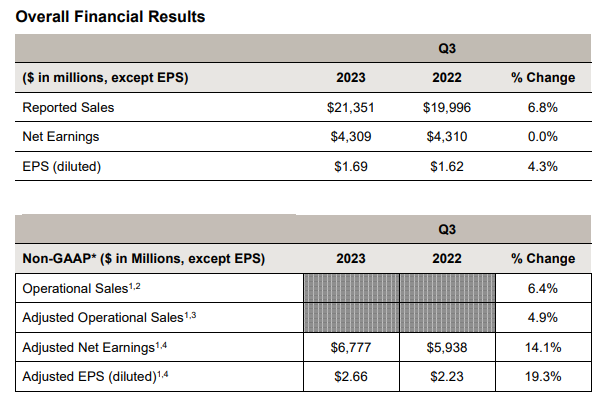
Sales Performance: The company reported a growth of 6.8% in their Q3 sales, reaching a whopping $21.4B. On breaking this down, the operational growth stands at 6.4%, with an adjusted operational growth rate of 4.9%. If you were to set aside the sales from the COVID-19 vaccine, the operational growth impressively touches 9%.
Earnings Snapshot: Earnings per share (EPS) showcased a promising climb, with a reported growth of 4.3% to settle at $1.69. The adjusted EPS painted an even brighter picture, skyrocketing by 19.3% to reach $2.66.
Future Prospects: Reflecting the company's robust performance and optimistic market outlook, JNJ has revised its 2023 full-year guidance, marking an upward trajectory for both sales and adjusted EPS.
Segment Results:

Strong Growth Trends: The worldwide adjusted operational sales for Innovative Medicine observed a healthy growth of 4.4%. On eliminating the contributions from the COVID-19 Vaccine, the figures are even more impressive, with operational sales marking an 8.2% growth.
Key Growth Drivers: A range of products contributed to this surge:
Oncology: Notable mentions include DARZALEX, ERLEADA, CARVYKTI, and other oncology products.
Immunology: STELARA, TREMFYA, and the dual mention of SIMPONI/SIMPONI ARIA led the charge.
Neuroscience: SPRAVATO made significant contributions.
Pulmonary Hypertension: UPTRAVI showcased commendable performance.
Points of Contention: Despite the robust growth, a few areas recorded offsets. These include the COVID-19 Vaccine in Infectious Diseases, ZYTIGA and IMBRUVICA in Oncology, and REMICADE in Immunology.
MedTech Division Insights:
Sales Performance: MedTech’s worldwide adjusted operational sales depicted a promising growth of 6%. The spotlight, however, was on the worldwide operational sales that surged by 10.4%.
Major Contributors: A diversified product portfolio propelled this growth:
Interventional Solutions: Electrophysiology products took the lead.
General Surgery: Wound closure products stood out.
Vision: The demand for contact lenses was noteworthy.
Advanced Surgery: Biosurgery products carved a niche.
Acquisition Impact: The acquisition of Abiomed was a strategic move, contributing a significant 4.6% to the operational sales.
These results cement JNJ’s dominant position in the medical innovation landscape, driven by a combination of organic growth and strategic acquisitions.
JNJ's Financial Guidance:

Adjusted Operational Sales:
October 2023: There's an expected change of 7.2% to 7.7%, with a midpoint estimate of 7.5%.
August 2023: Previously, the expected change ranged between 6.2% to 7.2%, with a midpoint estimate of 6.7%.
Observation: The company has revised its guidance upwards for adjusted operational sales by October.
Operational Sales:
October 2023: The guidance lies between $84.4B and $84.6B, with an expected change from the prior year ranging from 8.5% to 9%. The midpoint change is 8.7%.
August 2023: The guidance provided was between $83.6B and $84.4B, with an expected change from the previous year between 7.5% to 8.5%. The midpoint change was set at 8%.
Observation: Operational sales projections have been increased by October, both in absolute terms and as a year-over-year percentage change.
Estimated Reported Sales:
October 2023: Sales are expected to lie between $83.6B and $84B. The year-over-year change is anticipated to range from 7.5% to 8%, with a midpoint estimate of 7.7%.
August 2023: The projected sales were between $83.2B and $83.6B. The change compared to the prior year was expected to be between 7% and 8%, with a midpoint of 7.5%.
Observation: The estimated reported sales have also seen an upward revision in October.
In summary, JNJ has updated its full-year guidance for 2023 by October, showing an optimistic outlook compared to its projections in August. The company has revised upwards its expectations in all three categories: Adjusted Operational Sales, Operational Sales, and Estimated Reported Sales. This reflects a positive momentum in the company's performance and projections for the year.
My Take
When we take a look into JNJ's Q3 2023 results and their updated full-year guidance, the future looks solid. The company's growth trajectory is not only commendable but also indicative of its robust market position, being a hegemony, and strategic agility.
Q3 reported sales growth of 6.8% to a staggering $21.4B clearly underscores the company's expanding market footprint (without their consumer health segment). Especially when you consider that the operational growth. This highlights JNJ's core underlying businesses driving the surge, and it's not just a momentary boost from the pandemic response either. It's great to see management show optimism about their future, raising its 2023 full-year guidance for both sales and adjusted EPS. From my experience, this confidence often stems from consistent performance and a clear vision, both of which JNJ seem to possess in ample measure.
While looking more in-depth, the Innovative Medicine sector showcases robust growth, driven by a suite of products spanning Oncology, Immunology, Neuroscience, and more. MedTech's operational sales growth of 10.4% is yet another feather in the cap, signaling the company's diversification and mastery across multiple medical verticals. The upward revision in the full-year guidance, from August to October, is a clear testament to the company's relentless drive. Adjusted Operational Sales, Operational Sales, and Estimated Reported Sales, all exhibit upward trends, painting a picture of a company that's not just weathering market storms but riding the waves.
For me, JNJ continues to be a stable anchor in my portfolio, and I'm actively contemplating consolidating my position. While my current attention is directed towards undervalued growth stocks, should a golden opportunity present itself to acquire more JNJ shares, I will seize it without hesitation. My confidence in the company remains very high.
2. Lockheed Martin (LMT)
Lockheed Martin (LMT) released its Q3 2023 financial results this week. With a steady performance, the company reported net sales of $16.9B, marking a 2% YoY increase from $16.6 B in Q3 2022.
Key Financial Highlights:

The company's business segment operating profit for Q3 2023 stood at $1.8B, showing a slight decline of 5.63% from $1.9B in Q3 2022. Over the nine-month period in 2023, the operating profit was $5.3B, a marginal drop of 0.96% from $5.3B in 2022. LMT's consolidated operating profit for Q3 2023 was $2B, which was 5.42% lower than the $2.1B in the Q3 2022. For the nine months ending September 2023, the consolidated operating profit totaled $6.2B, growing by 2.63% from $6B the previous year.
The company reported net earnings of $1.6B in Q3 2023, down by 5.29% from $1.7B in Q3 2022. The net earnings for the nine-month duration of 2023 significantly jumped to $5B, marking a considerable 32.24% growth from $3.8B in 2022.
On the earnings per share front, the diluted EPS for Q3 2023 was $6.73, slightly up by 0.3% from $6.71 in the same quarter of the previous year. The nine-month period in 2023 saw an EPS of $19.97, a robust 39.54% growth from $14.31 in 2022.
In terms of cash flow, LMT's cash from operations in Q3 2023 was $2.8B, decreasing by 7.72% from $3.1B in Q3 2022. Over the nine months of 2023, the cash from operations reached $5.5B, a slight dip of 5.42% from $5.8B in the corresponding period of 2022. The company's free cash flow for Q3 2023 stood at $2.5B, down 7.36% from $2.7B in Q3 2022. For the first nine months of 2023, the free cash flow was $4.5B, down 6.77% from $4.8B in 2022.
While the company navigated some challenges in the third quarter of 2023, there are several silver linings that indicate a strong and promising outlook. Firstly, the consolidated operating profit for the first nine months of 2023 witnessed a growth of 2.63%, showcasing the company's ability to maintain positive momentum over a longer time frame. The highlight, undoubtedly, is the stellar performance in net earnings. Despite a dip in Q3, the net earnings for the first nine months of 2023 skyrocketed by an impressive 32.24%, which underscores the firm's capability to maximize profitability. This is further echoed in the earnings per share figures, where the nine-month duration of 2023 witnessed a robust 39.54% growth. Even in the challenging Q3, the company managed to slightly elevate its diluted EPS. Though there was a contraction in cash flow metrics, the company still reported substantial figures, with free cash flow for the first nine months standing at a robust $4.5B.
Ultimately, while some metrics in Q3 2023 faced headwinds, the company's nine-month performance, especially in net earnings and EPS, paints a picture of resilience, adaptability, and strong financial health.
Segment Results:
LMT currently operates across four distinct business segments, each tailored to specific products and services: Aeronautics, Missiles and Fire Control, Rotary and Mission Systems, and Space.

Aeronautics:
2023: $6,717B
2022: $7,089B
Decrease: 5.25%
Missiles and Fire Control:
2023: $2,939B
2022: $2,831B
Increase: 3.82%
Rotary and Mission Systems:
2023: $4,121B
2022: $3,781B
Increase: 8.99%
Space:
2023: $3,101B
2022: $2,882B
Increase: 7.59%
Total Net Sales:
2023: $16,878B
2022: $16,583B
Increase: 1.78%
The company displayed commendable resilience in 2023. While the Aeronautics segment experienced a slight decrease, it was compensated by the robust growth in the Missiles and Fire Control, Rotary and Mission Systems, and Space segments. The overall net sales increased by 1.78% YoY, reflecting the company's adaptability and strength in diversified sectors. This performance underscores the company's strategic positioning and potential for further growth in the coming years.
LMT’s Financial Guidance:
LMT remains confident in its trajectory and has reaffirmed its financial outlook for the entirety of 2023. Also, on a side note, the company has augmented its share repurchase authority by $6B, bringing the total authorization to a commendable $13B. Shareholders have another reason to be ecstatic too, as the company announced an uptick in its quarterly dividend to $3.15 per share.

Net Sales: The company expects its net sales for the 2023 to be in the ballpark of approximately $66.25B to $66.75B. This gives a range of $500M, indicating a potential flexibility or uncertainty in predicting the exact figure, but it provides a general idea of the company's sales forecast.
Business Segment Operating Profit: Lockheed Martin projects its business segment operating profit to range between approximately $7.325B to $7.375B. The small range of $50M suggests the company has a more precise expectation regarding its operating profit from its various business segments.
Diluted Earnings Per Share (EPS): Shareholders can anticipate the diluted EPS to be between approximately $27.00 to $27.20. This figure provides insight into the company's profitability on a per-share basis, factoring in potential share dilution.
Cash from Operations: LMT's cash flow from its primary revenue-producing activities is projected to be about $8.15B. This metric is vital as it gives a sense of the company's efficiency in generating cash from its core operations.
Capital Expenditures: The firm estimates its capital expenditures, which refer to investments in property, plants, equipment, and other assets, to be around $1.95B. This can be indicative of the company's reinvestment strategy and growth initiatives.
Free Cash Flow: Lastly, the free cash flow, which represents the cash a company generates after accounting for capital expenditures, is expected to be at least $6.2B. This metric provides a snapshot of the company's financial flexibility and its ability to fund dividends, reduce debt, or invest in new opportunities.
Essentially, LMT's 2023 financial guidance portrays a substantial scale of operations with billions in projected sales, profits, and cash flows. This guidance offers stakeholders a roadmap of what to expect from the company in terms of financial performance for the year.
My Take
LMT showcased resilience in its recent Q3 2023 results. Despite some modest YoY dips in specific quarters, the company's net earnings for the first nine months of 2023 witnessed an impressive surge of 32.24% from the previous year. This significant leap demonstrates the company's ability to navigate challenges and optimize its earnings potential. In addition to this, LMT's EPS narrative is notably positive. The diluted EPS for Q3 2023 saw a subtle increase, but the growth story shines brighter over the broader nine-month timeframe, marking a robust 39.54% ascent from 2022. The growth in EPS reflects both operational efficiency and a strong return for shareholders.
The company's outlook for 2023 gives me confidence. Anticipating net sales to be in the ballpark of $66,250B to $66,750B and a business segment operating profit ranging between $7,325B to $7,375B which underscores LMT's expectations of sustained momentum. Also, with the projected FCF to be upwards of $6.2B, LMT continues to prioritize its financial health and liquidity. While they indeed faced some challenges in specific quarters, the overall trajectory points to a future brimming with promise. The company's remarkable earnings growth, combined with an optimistic outlook, paints a great picture of a company poised for continued success and innovation in the aerospace and defense industry.
For me personally, I've heavily consolidated my position in LMT, positioning it in my top five holdings. It's with a heavy heart that I note the historical trend: during periods of geopolitical tension or rumors of conflict, defense stocks like LMT often experience significant appreciation. Recent developments, such as those involving Israel, have already led to an uptick in LMT's share price. Though it's speculative to draw definitive conclusions, this pattern isn't new. Nevertheless, my confidence in the company remains high.
3. Procter & Gamble
Procter & Gamble Company (PG) announced impressive results for the first quarter of fiscal year 2024.
Key Financial Highlights:

Net sales reached $21.9B, marking a six percent growth from the previous year. Even more notably, organic sales, which factor out the effects of foreign exchange, acquisitions, and divestitures, saw a 7% increase. Furthermore, diluted net earnings per share stood at $1.83, representing a robust 17% increase YoY.
For the quarter, PG reported a robust operating cash flow of $4.9B and net earnings amounting to $4.6B. Highlighting its efficiency, the adjusted free cash flow productivity was an impressive 97%. On a side note, the company demonstrated its commitment to shareholders, PG allocated a substantial $3.8B of cash back to them. This was achieved through approximately $2.3B in dividend distributions and $1.5B channeled towards common stock buybacks.
Segment Results:

Beauty Segment: Organic sales saw a rise of 5%. Notably:
Skin and Personal Care: Sales grew by low single digits. This was a result of increased pricing and innovative volume growth. However, these gains were somewhat counterbalanced by a less favorable mix stemming from reduced sales of SK-II.
Hair Care: Sales experienced a high single-digit growth, mainly propelled by increased pricing.
Grooming Segment: Showed a growth of 9% in organic sales, with all regions contributing to organic sales growth. While higher pricing and a favorable product mix boosted the sales, some of the growth was offset by volume declines linked to pricing.
Health Care Segment: Organic sales surged by 10%. Highlights include:
Oral Care: High single-digit growth due to a combination of increased pricing and a beneficial product mix.
Personal Health Care: Double-digit growth spurred by increased pricing, innovative volume growth, and a surge in demand for respiratory products.
Fabric and Home Care Segment: Organic sales grew by 9%.
Fabric Care: Sales grew by high single digits, thanks to increased pricing and a positive product mix. However, this was somewhat tempered by volume drops, especially in Asia.
Home Care: Witnessed a low teen percentage increase, fueled by raised pricing and a favorable mix of premium products.
Baby, Feminine, and Family Care Segment: Organic sales expanded by 7%.
Baby Care: Mid-single-digit growth was recorded, buoyed by increased pricing and a favorable product mix, although pricing-related volume declines did have a dampening effect.
Feminine Care: High single-digit growth was driven by elevated pricing and a beneficial geographical and product mix, though offset slightly by pricing-related volume decreases. Organic sales flourished across all regions.
Family Care: Mid-single-digit growth came about from raised pricing but was partially curtailed by an unfavorable pack size mix.
PG showcased pretty good growth across multiple segments, with organic sales consistently outpacing the previous year's results. The Beauty Segment witnessed a solid uptick, especially in Hair Care, thanks to innovation and their positive pricing strategies. The Grooming and Health Care segments posted decent numbers, each enjoying nearly a double-digit percentage growth. Health Care's double-digit growth, particularly in Personal Health Care, highlights the company's successful innovation and its alignment with market demands, such as respiratory products. The Fabric and Home Care segment, too, has been on an upward trajectory, with Fabric Care and Home Care both benefiting from effective pricing and product strategies. Lastly, the Baby, Feminine, and Family Care Segment saw strong growth across all its categories, especially in the Feminine Care sector. With growth observed across all regions for multiple products, it's evident that the company is not only tapping into current market trends effectively but is also poised for continued success in the future.
PG’s Financial Guidance:
Sales Growth and Foreign Exchange:
All-in Sales Growth: PG has adjusted its projection for fiscal 2024 all-in sales growth to fall between two and four percent compared to the previous year.
Foreign Exchange: The company anticipates foreign exchange to adversely impact all-in sales growth by one to two percentage points.
Organic Sales Growth:
PG maintains its forecast for organic sales growth, projecting an increase of four to five percent.
Earnings Per Share (EPS):
Growth Rate: The company expects its fiscal 2024 diluted net EPS to grow between six and nine percent.
EPS Range: This growth translates to an EPS in the range of $6.25 to $6.43.
Considerations: P&G highlights that it has retained this EPS range despite facing an additional post-tax foreign exchange headwind of $600 million since its initial guidance in late July 2023.
Financial Headwinds & Tailwinds:
Tailwinds: For the fiscal year 2024, the company is set to benefit from about $800 million after-tax, stemming from positive commodity costs.
Headwinds: On the other hand, PG foresees challenges arising from:
Unfavorable foreign exchange rates, estimated to be around $1B after tax.
A combined net impact from interest expenses and interest income, amounting to roughly $200M after tax.
Taxation & Capital Spending:
Tax Rate: The projected effective tax rate for fiscal 2024 stands at about 21%.
Capital Spending: The company estimates its capital spending to be roughly 4.5% of its net sales for fiscal 2024.
Cash Flow & Shareholder Returns:
Adjusted Free Cash Flow Productivity: PG aims for a productivity rate of 90% for its adjusted FCF.
Dividends & Share Repurchases: The company plans to:
Disburse over $9B in dividends.
Buy back common shares worth between $5B and $6B during fiscal 2024.
My Take
PG showed signs of consistent growth and resilience in an ever-evolving market landscape. The recent financial performance highlighted the company's strong foundations, with first quarter fiscal year 2024 net sales soaring to $21.9B, marking a commendable 6% rise from the prior year. The organic sales trajectory, which mirrors the heart of PG’s brand strength, has seen a remarkable 7% uplift.
When we looked into PG's product segments, from Beauty to Health Care, and from Fabric and Home Care to Family Care, there's a universal theme of growth. Each segment showed impressive organic sales increases, indicative of PG's ability to innovate and adapt to consumer demands. This growth across the board isn't just numbers on a balance sheet; it's a testament to the company's enduring connection with global consumers. With projected all-in sales growth between 2%-4% four and focus on organic sales growth, PG's strategic roadmap is clear and ambitious. Their anticipated earnings per share, ranging between $6.25 and $6.43, amidst the challenges of foreign exchange headwinds, emphasizes the company's strong financial strategy and adaptability.
I’ve held PG for almost a decade, with its finger on the pulse of consumer needs, a clear vision for the future, and a commitment to delivering value, their horizon is bright and filled with boundless opportunities. For me personally, I've chosen not to acquire additional shares of PG as I'm pivoting my attention to undervalued growth stocks. Nevertheless, my confidence in PG remains high.