

Lemonade's Best Quarter Ever
Taking a Look at Lemonade's (LMND) Q4 2024 & Full-Year Earnings Results.

Missing the Forest for the Trees
Lemonade (LMND) reported their Q4 2024 and full-year 2024 results yesterday after-hours, with their earnings call taking place today pre-market. LMND actually exceeded analyst expectations for Q4 2024 revenue and EPS, the company's forward-looking guidance fell short of market projections though, causing a temporary dip in the stock price AH & PM (more on this later). For Q1 2025, they anticipate revenue between $143M and $145M, below the analyst consensus of $151.4M. Similarly, the full-year 2025 revenue forecast of $655M to $657M is less than the expected $667.5M. Nonetheless, LMND had its strongest quarter to date, delivering record revenue growth, improved loss ratios, and +FCF.
Lemonade Q4 2024 & Full-Year 2024 Earnings Breakdown
LMND reported $148.8M in total revenue, a 29% YoY increase. This growth was fueled by higher gross earned premium, ceding commission income, and net investment income. At the same time, In Force Premium (IFP) grew to $943.7M, reflecting a 26% increase YoY and marking the company’s fifth consecutive quarter of accelerating IFP growth.
Another important indicator of their improving business model is its premium per customer, which grew 5% YoY to $388. This is because customers are purchasing higher-value policies and/or renewing at higher rates, reinforcing LMND’s ability to monetize its user base more effectively over time.
Total Revenue: $148.8M, up 29% YoY
In Force Premium (IFP): $943.7M, up 26% YoY
Gross Earned Premium (GEP): $226.4M, up 25% YoY
Premium Per Customer: $388, up 5% YoY
Profitability & Cash Flow Performance
LMND significantly narrowed its net loss in Q4 2024, reporting a GAAP net loss of $30M, a 29% improvement YoY. This improvement was largely due to higher gross profit and stable expenses, even as the company continued investing heavily in customer acquisition.
One of the biggest milestones for them was achieving its first-ever positive Adjusted EBITDA excluding growth spend. This means that if LMND had not increased marketing expenses, it would have been profitable on an adjusted basis (GAAP is becoming closer, more clear). Additionally, the company reported $26.5M in Adj. FCF, marking its second consecutive quarter of positive cash flow.
Net Loss (GAAP): ($30)M, a 29% YoY improvement
Adjusted EBITDA Loss: ($23.8)M, a 18% improvement YoY
Gross Profit: $63.9M, up 90% YoY, with gross margin expanding from 29% to 43%
Adjusted Free Cash Flow (Adj. FCF): $26.5M, compared to ($11.3)M in Q4 2023
First-ever positive Adjusted EBITDA excluding growth spend
Loss Ratio & Underwriting Performance
Their Gross Loss Ratio (GLR) has been on a steady downward trend, which means that their customer cortex as a whole has become much more efficient. The AI-driven underwriting models are becoming much more precise. In Q4 2024, Lemonade reported a GLR of 63%, which is a massive improvement from 77% in Q4 2023. This marks the sixth consecutive quarter of improving loss ratios, proving that their pricing policies more accurately and reducing claims volatility.
Gross Loss Ratio (GLR): 63%, down from 77% in Q4 2023
Trailing Twelve-Month (TTM) GLR: 73%, down from 85% in full-year 2023
Net Loss Ratio: 62%, down from 78% in Q4 2023


Despite this progress, management warned that Q1 2025 will see a temporary uptick in GLR due to wildfire-related losses. The company expects a $45M gross loss from the California wildfires, with a net EBITDA impact of $20M. While this will inflate Q1’s loss ratio, it is expected to be a temporary setback rather than a permanent structural issue. LMND remains confident that its loss ratio will continue to improve throughout 2025 as rate adjustments take effect with this as well.
FY 2024 Results
For the full year, they saw strong revenue growth, improved underwriting performance, and narrowing losses. Revenue for 2024 reached $526.5M, a 23% increase YoY, while gross profit nearly doubled to $166.9M. At the same time, GAAP net loss improved by 15% YoY, reflecting better expense discipline and loss ratio management.
Total Revenue: $526.5M, up 23% YoY
Full-Year Gross Profit: $166.9M, nearly doubling YoY
GAAP Net Loss: ($202.2)M, an improvement from ($236.9)M in 2023
Adjusted EBITDA Loss: ($149.7)M, improving from ($172.6)M in 2023
Full-Year Adjusted Free Cash Flow (Adj. FCF): $48M, LMND’s first-ever full year of positive Adj. FCF
Cash Position & Liquidity
LMND remains in a strong financial position, with over/around $1B in total cash and investments. This liquidity gives the company ample runway to continue its growth initiatives while absorbing some short-term losses.
Total Cash, Cash Equivalents & Investments: $1B as of Dec 31, 2024
Regulatory Surplus (Held by Insurance Subsidiaries): $271.4M
Borrowings under Synthetic Agents Program: $83.4M
Extended financing agreement through Dec 2026, securing an additional $200M for growth


Growth Spend & Expenses
LMND has also continued to ramp up its marketing and customer acquisition efforts, more than doubling its growth spend over the past year. This spending has been highly efficient, as shown by their 3:1 LTV-to-CAC ratio.
Sales & Marketing Spend in Q4 2024: $47.7M, compared to $24.5M in Q4 2023
Total 2024 Growth Spend: $122M, up from $55M in 2023
Projected 2025 Growth Spend: ~$165M
While this growth spending delays short-term GAAP profitability, it is fueling the company’s expansion and allowing it to capture market share more aggressively.
Key Takeaways & Outlook
They delivered record revenue, gross profit, and cash flow improvements in Q4 2024 and full-year 2024.
Loss ratios continue to decline, demonstrating the effectiveness of AI-driven underwriting.
Cash position remains strong, with over $1B in liquidity.
2025 guidance includes a temporary increase in loss ratios due to wildfires, but overall improvement is expected.
Growth spend remains a major factor—expected to increase in 2025, temporarily delaying GAAP profitability.
Long-term goal: Achieve sustained Adjusted EBITDA profitability by 2026, followed by GAAP profitability.
My Take
LMND has delivered another solid quarter overall, despite facing challenges outside of its control—namely wildfires. When you take a step back and look at the bigger picture, it’s pretty clear where this company is headed. Sure, it’s still operating at a loss in the near term, which can look rough right now. But over the long haul, there’s every reason to believe this could become a cash flow machine.
In many ways, their journey reminds me of Root Insurance (ROOT). I’m not necessarily endorsing Root, but it does offer a useful comparison of their inflection point and what happened to the stock price. LMND is at that stage where the bulls will likely face pushback. If you hold a bullish stance today, you’ll probably get criticized by the bear (the one that’s smarter than everyone because they worked in insurance and only their perspective goes)—just like with most multi-baggers before they finally break out. That’s the natural flow of the investor human psyche: a lot of people get bogged down in the short-term negatives, finding it hard to imagine a brighter future simply because the “now” seems just “so horrible”. There’s nothing inherently wrong with that perspective; it’s just difficult for some folks to look beyond the immediate challenges. Which is why knowing what you own and having emotional intelligence is huge in general. Still though, I want to lay out my own reasoning, hopefully providing more clarity on why I remain optimistic about their long-term potential, and I’ll also provide a brief valuation.
Lemonade’s Profitability Without Growth Spend (GAAP vs. Adjusted Basis)
LMND’s recent earnings report paints an interesting picture: strip out the heavy spending on growth, and the company would be profitable on an Adj. EBITDA basis—though it would still show a loss when you factor in GAAP accounting. In Q4 2024, they hit a milestone by reporting its first-ever positive Adj. EBITDA excluding growth spend, suggesting that its core insurance and underwriting business is inching toward sustainability. The reason it still reports a GAAP loss is pretty straightforward—GAAP includes things like stock-based compensation, depreciation, amortization, and other non-operating costs, which all weigh down the bottom line (I’ll get into below). So, if you ignore LMND’s aggressive marketing and expansion costs, its day-to-day insurance operations are already generating positive cash flow. But the company is still investing heavily in future growth, which continues to push true GAAP profitability down the road. This is the whole point. The key takeaway here though is that their per-customer economics look promising, even if all those extra expenses mean it’s going to take a bit longer for the headline numbers to catch up.

As you can see in the first chart, there are two lines: the solid pink line for Adj. EBITDA and the dashed pink line for Adj. EBITDA excluding growth spend. Notice how the dashed line turns positive in Q4 2024—this is a major milestone. It shows that if Lemonade dialed back its aggressive growth investments, it would already be operating at a positive Adj. EBITDA. However, the solid line remains below zero, reflecting the impact of ongoing growth spend on the company’s total Adj. EBITDA. What happens when they take their foot off the gas pedal on growth spend?
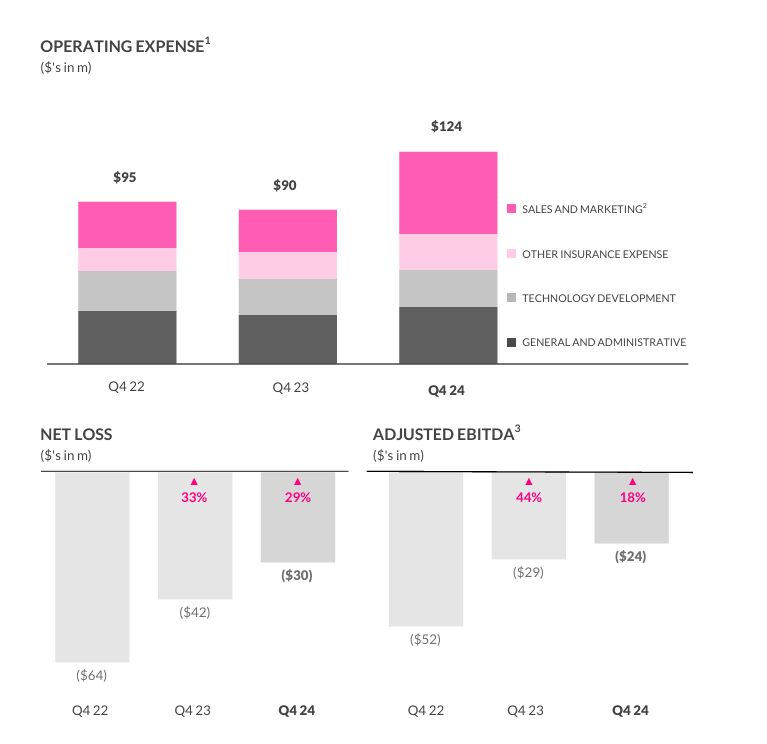
Look at the bar chart for opex. You’ll see that sales and marketing (the top pink segment) accounts for a big portion of total costs, alongside technology development, general and administrative expenses, and other insurance costs. As they invest heavily in customer acquisition and product development, overall expenses have risen from Q4 2022 to Q4 2024 (this should be expected).
The smaller bar charts below break down net loss and Adj. EBITDA. Even though net loss is still negative, the gap has narrowed, and Adj. EBITDA continues to improve as well—further evidence that while LMND isn’t yet profitable on a GAAP basis, its core underwriting business is making progress. The big picture lens points to profitability soon on a GAAP and non-GAAP basis.

The Net Loss, Adj. EBITDA, and GEP are trending together. The net loss-to-GEP ratio (the pink line) has improved over time, dropping from the negative 40s to around the negative teens. This is important: it means that for every dollar of premium the company writes, it’s losing less money than before—a sign of improving unit economics.

The IFP vs. Opex chart shows two lines: the pink line for LMND’s IFP, which has climbed sharply, and the gray line for operating expenses if you strip out growth spending. Just for clarity here, the company is always going to have some sort of “growth spending”. That consistent number in the future is undetermined, but I believe it’s reasonable to assume that this number would be at least $70M-$100M less than where it is today. But while IFP has nearly doubled, opex (excluding growth) has remained relatively stable. This gap highlights the scalability of their core insurance engine. The more the company grows its premium base without equally ballooning its base operating costs, the closer it gets to sustainable profitability.
To add more fuel to the fire here, stock-based compensation also takes a noticeable toll on their GAAP profitability, since it counts as an expense on financial statements and therefore reduces net income. In Q4 2024 alone, they spent $18M on SBC, contributing directly to its $30M GAAP net loss. Over the course of the entire year, those costs are expected to reach $60M, marking a hefty slice of the company’s overall expenses. Although SBC doesn’t affect their cash flow, it does dilute existing shareholders by increasing the pool of outstanding shares which isn’t too bad at all hovering around 71M. But this helps the company also retain top-tier talent while conserving cash—a move that can prove beneficial for them still in aggressive growth mode.
Like many fast-growing companies, LMND doesn’t rely solely on GAAP metrics because those numbers can get skewed by non-cash expenses, front-loaded marketing, and the complexities of reinsurance. GAAP standards, while necessary, don’t always paint the clearest picture of the company’s underlying performance. Which is why LMND spotlights Adj. EBITDA, Adj. Gross Profit, and Adj. Free Cash Flow—to give investors a better sense of how its core insurance operations are actually performing once you strip away these short-term distortions. Even when LMND breaks out these adjusted metrics, some traditional insurance folks get bent out of shape. Ironically, these numbers are exactly what they need, because they give a clearer snapshot of how the core business is really performing—something standard GAAP metrics alone can sometimes obscure and make it much more difficult to see the big picture.
One of the biggest factors driving their GAAP losses was the SBC we mentioned above. SBC is still a non-cash expense—no money is leaving LMND’s bank account. That’s why they exclude it from adjusted figures: it’s trying to show what its operations look like without the noise of equity-based compensation.
Another item that skews GAAP profitability is depreciation and amortization (D&A). LMND has invested heavily in technology and infrastructure, so it’s taking sizable D&A charges. Again, these are non-cash costs; they represent past investments and don’t affect current cash flow. By adjusting for D&A, the company emphasizes its real-time operational health rather than accounting expenses tied to previous spending.
Like I mentioned, the customer acquisition strategy also contributes to its GAAP losses in the short run. The company invests heavily in marketing upfront, expecting to recoup those costs over time as newly acquired customers generate revenue for years to come. Hence, large GAAP losses today can actually be viewed as investments in future earnings. LMND’s Adj. EBITDA excluding growth spend highlights this point; when you back out all that marketing investment, the core underwriting operations are already inching toward breakeven. Then, reinsurance agreements make GAAP reporting even more complex. They only recognize net earned premium as revenue under GAAP, so any commissions from reinsurers don’t show up in the top line—effectively understating its gross profit. Adjusted metrics bring those ceding commissions back in, showing a more accurate view of the company’s true underwriting results.
California Wildfires
The California wildfires took center stage on the earnings call because they weaken LMND’s guidance and push profitability further out. Still, it’s important to recognize the company has already taken steps to dial back its exposure in the state, gradually exiting the California market over time. Even so, some policies remain on the books, meaning there’s still a degree of wildfire risk. But this was the reason we saw a decline in share price AH. As stated on the call and in the letter, LMND’s 2025 guidance came in a bit weaker than some analysts expected, largely because of the California wildfires. Management estimates a $20M hit to EBITDA—much lower than the initial external projections of over $200M in potential wildfire-related losses. According to management, they are confident in these precise projections because of its conservative underwriting and geographic diversification helping them keep the financial damage relatively contained. However, this is indeed a temporary setback, and this will materialize in Q1 2025.
The company actually expects to incur $45M in gross losses from the wildfires, but sees the net loss impact at just $20M. Two main factors explain that discrepancy:
Reinsurance Coverage – They offset much of the gross losses through existing reinsurance arrangements.
Diversification – Since LMND isn’t solely focused on homeowners’ policies, its exposure to catastrophic events like wildfires is spread across multiple insurance products, cushioning the overall hit.
All told, while a $45M headline number is significant, their risk management decisions—such as removing higher-risk policies and maintaining strong reinsurance—helped mitigate the damage. Management also noted that if they hadn’t taken these steps, wildfire-related losses could easily have been five times higher.
Rate Increases Will Help Lemonade’s Top and Bottom Line
Securing rate increases across multiple product lines is going to boost LMND’s top and bottom lines in 2025 and beyond. Customers will be paying higher premiums, which increases IFP and GEP, while aligning rates more closely with claims costs should help bring down their GLR. The end result is improved cash flow: claims costs don’t rise in lockstep with premiums, so these adjustments should accelerate their path to positive cash flow. Combine this with their growth rate in customers, even with growth spend increasing we will see an acceleration toward profitability.
A major highlight from the earnings call is that LMND enters 2025 with ‘rate adequacy’ across most of its insurance portfolio. In other words, the premiums now reflect the actual risk they are taking on. Because these rate hikes will roll out gradually over the course of the year, the financial benefits will accumulate steadily, improving margins as time progresses.
Expect Losses to Increase Temporarily Due to Accelerated Ad Spend
Losses will increase temporarily as growth spend accelerates, unless top-line revenue and bottom-line profitability scale simultaneously. In this unique case, it won’t be as noticeable, but with a reasonable view we should expect increased losses. This is a key risk to LMND’s growth strategy—if revenue and profitability fail to keep pace with marketing spend, losses could widen further before improving.
However, their current trajectory suggests that it expects the business to scale efficiently. If its LTV-to-CAC ratio holds steady, and its GLR continues improving or remain at consistent/sustainable levels, then over time, the top-line growth should outpace its losses, leading to profitability in the coming years. The company is currently projecting Adj. EBITDA breakeven by the end of 2026, with GAAP net income following roughly a year later.
Management’s Comments on the 700,000 Car Waitlist & Why They Are Being Conservative
LMND sees its car insurance business as a major long-term growth driver, but the company is deliberately taking a slow-and-steady approach—even with a 700,000-person waitlist. Three main factors guide this caution:
Complex, Competitive Landscape
Auto insurance is notoriously challenging, and LMND needs precise underwriting to ensure sustained profitability.
Refining AI Pricing Models
The company wants to perfect its AI-driven, telematics-based underwriting to accurately price risk before scaling aggressively.
Avoiding Industry Pitfalls
There’s a history of auto insurers expanding too fast and suffering major losses due to insufficient risk controls.
CEO Daniel Schreiber compared it to “revving the engines but not putting the car into first gear fully yet,” on the call but the choice to grow profitably rather than chase raw volume. Over the next two years, they plan to gradually expand its car insurance into more states, tapping into new customer segments.
Why is this market opportunity so important? The auto insurance market is massive as we know—worth hundreds of billions of dollars in the U.S. alone. Even capturing a tiny sliver of that market could significantly boost LMND’s revenue and put it on a faster track to profitability. Unlike other lines of business where they kinda have to educate the market about an innovative new product, car insurance is already well understood and in high demand. By combining a refined AI underwriting model with a carefully managed rollout, they might be setting themselves up to secure a profitable foothold in this market—one that requires only a small share to move the needle on its bottom line.
Valuation
Since LMND doesn’t have an earnings yet, I’m going to put together a reverse discounted cash flow model with reasonable assumptions in place. Some may not agree with these but have the perspective of this being somewhat conservative.
RDCF
To determine LMND’s intrinsic value, we use a Reverse Discounted Cash Flow (Reverse DCF) model, which estimates the company’s future cash flow and discounts it back to present value to determine how much the stock is worth today. Since they are not yet profitable, this model helps us understand what level of growth and profitability the market is currently pricing in and whether those expectations are reasonable.
The most common valuation in this industry is the PB ratio/PBV but it isn’t the best way to value LMND. This is largely because they are high-growth, tech-driven operating under a very different model than traditional insurers. For most insurers, PB works well because they’re asset-heavy—think large investment portfolios of bonds, cash reserves, and real estate—so their book value closely reflects what underpins their earnings potential. LMND, by contrast, relies on AI-based underwriting and a digital-first customer acquisition strategy, neither of which show up on the balance sheet in the same way physical assets do. It also records significant losses early on (for example, from SBC and marketing), which can drive its book value close to zero or even negative. In that scenario, PB either becomes sky-high—making LMND look overpriced—or downright meaningless. Traditional insurers like Progressive or Allstate focus on investing their “float” and thus have tangible assets to bolster their book value, which explains why PB is a more fitting yardstick for them. In this case, however, its book value simply doesn’t tell the whole story, so relying on PB alone paints an incomplete picture of the company’s true potential.
For this RDCF model, I’ll begin by projecting LMND’s revenue over the next 10 years, factoring in both its historical trends and planned growth spend. Given their commitment to aggressive customer acquisition, revenue growth is expected to remain elevated at 27% for 2025-2026, tapering to 24% in 2026-2027 and 25% in 2027-2028. After this, growth should gradually slow as Lemonade nears its market saturation point, stabilizing at 17% by 2035. With these assumptions, their revenue is projected to grow from $526.5M in 2024 to between $15B-$18B by 2035, assuming it successfully scales its business across multiple insurance verticals which they haven’t done yet.
A key component of this model is that after a year and a half, their peak growth spend is expected to decline by $80-$100M, significantly reducing operating expenses. This means that while the company is currently investing heavily in customer acquisition and brand expansion, it plans to scale back growth spending after achieving a critical mass of policyholders. That doesn’t mean they stop spending cash on customer acquisition altogether, it means they are simply going to be taking their foot off the gas after this next round of growth spend. This shift should materially improve profitability metrics without significantly sacrificing growth, as LMND transitions from hyper-growth mode to a more sustainable expansion strategy.
One major shift in this model is how it handles opex and customer acquisition costs, both of which are critical to LMND’s growth story. Unlike traditional insurers that rely on hefty capital reserves and physical infrastructure, LMND’s tech-driven model allows for a much leaner cost structure. As a result, the model assumes opex will steadily rise from $88M in 2024 to a maximum of $125M by 2035, reflecting inflation and expansion needs but still maintaining overall efficiency. Meanwhile, customer acquisition costs—which were once a huge chunk of their spending—are expected to level off at around $60–$65M per year sometime late 2026. That shift signals a move away from hyper-growth spending and toward a more balanced approach, focused on organic retention and steady premium growth.
On the valuation side, FCF sits at the center of the analysis. The model projects LMND could hit net income margins of about 10%, a notch higher than legacy insurers thanks to its AI-enabled automation. Capex is at roughly 3% of revenue and should taper as they scale up, boosting efficiency. From there, FCF is simply net income minus capex, opex, and customer acquisition costs.
Because money today is worth more than money in the future, the model applies a 10.5% discount rate (WACC) to factor in execution risks and the broader volatility of the insurtech space. Each year’s FCF is discounted back to present value, preventing an overinflated outlook. Beyond 2035, where projections get hazier, the model uses a 3.5% terminal growth rate (TGR) to reflect a more stable, long-term expansion. That future value is also discounted, culminating in an enterprise value (EV) that represents LMND’s intrinsic worth.
Dividing the EV by an expected 91M shares outstanding in 2035—to account for dilution from SBC and future share issuances—yields an intrinsic share price of $80 to $120. This jump comes from LMND opex staying lean, stabilizing growth spending, and potentially scaling revenue up to around $15B. The revised model suggests LMND could grow into a $10B+ company, with significant upside for its stock price—especially if the market eventually applies more aggressive multiples like a higher P/E or EV/EBITDA once they show solid profitability. If the share price currently sits below $80, that hints the market is underestimating their potential.